
We’ve also expanded CoTherm’s visualization and automation capabilities to make it easier to analyze results, couple simulations, and optimize for comfort and performance.
Enhanced Data Visualization and Process Automation
CoTherm 2025.2 introduces new visualization tools and workflow enhancements that streamline data interpretation and automate analysis across coupled simulations.
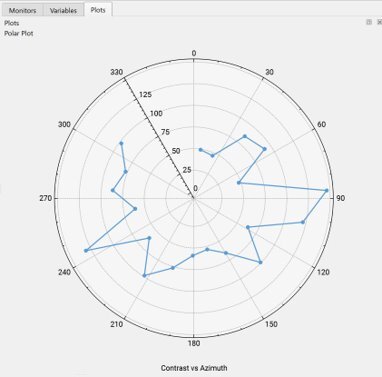
Polar Plots: Added support for polar plots, allowing users to visualize data in terms of angle and radius on a polar coordinate system.
New Plotting Examples: Added example processes that demonstrate how to create scatter and polar plots from scalar monitors, array monitors, and Python data.
Improved Human and Battery Processes: Added practical examples that automatically parse and plot human comfort and battery results using Python, helping users quickly generate visualizations without manual file parsing.
Expanded Input and Result Variables: TAITherm input variables now support power input parameters, and result variables now support segment-level human output parameters for Berkeley Sensation, Comfort, and Teq, allowing users to run comfort-driven optimizations through CoTherm’s built-in Dakota optimizer.
Comments
0 comments
Article is closed for comments.